
Keliweb vs SiteGround vs GoDaddy...
This article was written in Italian and translated into English. Read the original
Short version for the lazy:
For those who just want an answer and are not interested in reading my whole analysis:
In the course of my analysis, SiteGround and GoDaddy as shared WordPress hosting turned out to be between 10x and 20x faster than Keliweb !!

Detailed version (and extremely technical):
I should say up front that I have never been a fan of WordPress, but out of necessity I had to start dealing with it, and I wrote this article as a result of my direct experience with Keliweb, whom I invite to contact me for any correction...
It all started from the monitoring system I use ("MONITIS.COM") to keep an eye on other sites of mine: I started receiving constant alarms from just one in particular, BURRACO.COM, which was on the shared WORDPRESS hosting, on a dedicated IP, at "Keliweb" - a company I had chosen because I had heard good things about it.
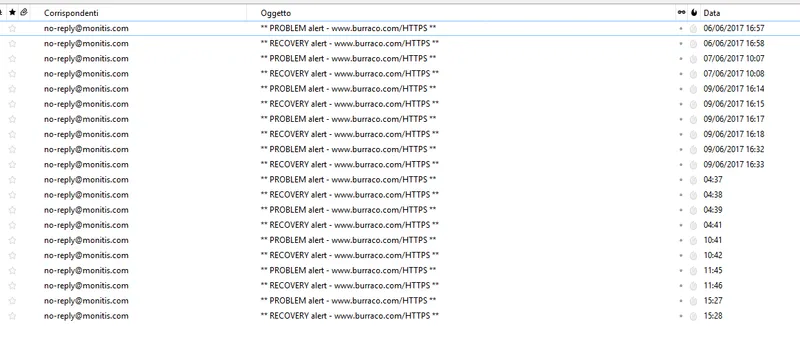
After an initial phase in which I didn't understand where the problem was, and after a few exchanges of messages with Keliweb's technical support, whose solution always aimed at proposing that I move to a "dedicated" server (instead of trying to understand the nature of the problem), I decided to dig into the matter on my own, and to do a small analysis and then compare the performance with two other big competitors: SiteGround on one side (found by searching on google) and GoDaddy (which I already know and have been using for years and where I already have another site, again on WP on shared hosting).
The setup from which I start my analysis is therefore the following (I'm repeating a bit of everything): the site is www.burraco.com, hosted at KeliWeb on shared hosting, on a dedicated IP. In front of it I put a CloudFlare that I use both for security and for the HTTPS part - and of course I'm not using content caching.
The tools I used for the analysis are: on one side MONITIS.COM, which I consider the best monitoring system at the moment, and which I have used for a bit more than 10 years (when it wasn't even called that yet) and on the other side simply Google Chrome in "debug" mode.
Monitis in particular allows you to monitor a series of services starting from different datacenters around the world. In my case, the ones I usually choose are Italy, Spain, and US-EAST because it lets me understand, when there is a problem, whether it is a matter limited to European connectivity problems or whether it extends across the ocean as well. Lately I have also added France for several reasons.
As for Google Chrome in "debug" mode, I went to check the page loading times and try to understand where exactly the problems occurred most. Just in case, I ran the tests with Chrome from desktop workstations located in three different places: Malta, Rome, and Florence.
To run the tests impartially, and excluding CloudFlare, I pointed a MONITIS in HTTPS directly at the IP of the real machine (185.17.107.119), at Keliweb, manually modifying the GET request header by adding the "HOST" header and making it point to www.burraco.com.
Afterwards, I created a second monitor, this time directly in HTTP, because due to SSL certificate validation it is not always possible to understand exactly what is going on when monitoring, so I pointed, in http, www.burraco.com, again with the header modified to www.burraco.com to avoid any form of redirect.
Now let's move on to the charts:

The one above is the chart at a distance of 1 week from today's date, in HTTPS on direct IP, with the site still on Keliweb. Since the data is collected every minute, zooming out the view to the day and to the week (as in this chart) gives averages. The red dots represent timeouts, which until the evening of 17/6 were set to 10 seconds (the monitis default) while afterwards I raised them to 30 seconds to better understand what was happening. The time in seconds here expresses the time needed to download up to the response headers of the page from the http server (at least that is the explanation provided by monitis technical support). Monitis in fact distinguishes between monitors that then parse the contents of the page (for example, to check whether a certain string is present in the page), and "pure" monitoring where it doesn't matter to process the content of the page, but only to see whether the site is UP. In the first case, of course, they say that the time refers to downloading the whole html page, without further calls to images, css, or anything else. In the second case, that is monitoring only without content verification, MONITIS says the time is calculated up to the receipt of the HEADERS of the http server's response. This of course also includes all the other phases, which are more or less the sum of TCP_CONNECT + SSL_HANDSHAKE + http_REQUEST_SEND + http_REQUEST_RECEIVE + REDIRECTS. I wasn't very convinced that in one case the time refers to reaching the HEADERS of the http server's response (also because the HEADERS don't travel on parallel sockets, they travel on the same SOCKET on which the request was made, at the head of the HTML page, but this consideration may have nothing to do with it), but just in case and to put in a good word for Keliweb, let's pretend that the times always include the full download of the html page too, not only the headers, still without any images or css or anything else.
Having made all these premises, let's move on to analysing the results of the various tests.
In the chart published above, which refers exclusively to the site hosted on Keliweb, you can see how the "average" waiting times for the page response, in HTTPS, are around 6 seconds, with peaks that unfortunately often exceed 10 seconds, and sometimes even exceed 30 seconds of waiting (see in particular after 17/6, when I moved the timeout from 10 to 30 seconds, where you can better see the trend).
In case it might be some kind of problem linked to HTTPS, I also set up, as mentioned, a monitor in HTTP, always pointed directly at the IP of the KeliWeb server, always modifying the request HEADERS to include www.burraco.com as HOST, and this is the result:

It would seem to go better, but we are still around 3 seconds on average (as a daily average), and here too with several peaks exceeding 10 seconds and 30 seconds (this time I set the monitor directly with a 30-second timeout). But let's look in detail at a chart, again of the same monitor, limited to the last 24 hours so as to better understand what is going on…

This is the result… in practice there are always peaks above 6 seconds, and often they easily exceed 30 seconds (the red dots), so the chart goes into timeout at those single points. So the problem is not HTTPS, and in this way we have ruled out any doubt about possible redirects from the http version to the HTTPS one. Besides, the site is in any case set up to be browsed on www.burraco.com and not on burraco.com, so there are no redirects at all, 100% sure, that could slow down the result.
In case of further doubts, I also checked the headers sent and received (I have no screenshot, sorry), but I didn't find any anomalies there either.
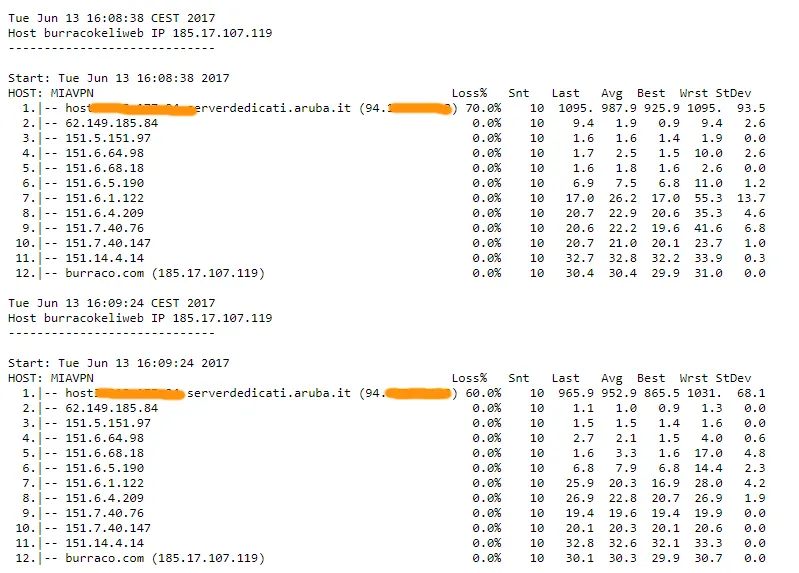
The doubt that remained at this point was that it might be problems related to routing (that is, on the networking side) - for this reason I added an MTR trace from another Linux server of mine that I use for these things, which, through a "customized" bash script, gives me a detailed routing report every minute. This tool, MTR, which is perhaps not known to most, is usually used in professional settings to understand whether there has been a rerouting caused, for example, by damaged routers or by the intervention of special antiDDoS mechanisms (the "vacuum" systems that reroute traffic at the BGP routing level). In short, it is a sort of advanced traceroute.
In the following chart I deliberately hid, for security reasons, the IP of my source machine, my Linux server at Aruba. The point, however, is that even during the downs, I verified from the logs that the routing stayed unchanged (even widening the view to several hours, to compensate for any differences in time between different servers), and there is no packet loss.
During all these tests, I had to carry on (sometimes with some difficulty) the exchanges of messages with Keliweb's support, who blamed the problem each time on something different. At first they told us that the problem was that the monitor was pointing to Cloudflare and that therefore the problem was probably in CloudFlare, but that in case of problems they recommended... to move to a dedicated server. When we removed Cloudflare from the monitoring and pointed to the direct IP, they told us that our site often reached 100% CPU and therefore they recommended... to move to a dedicated server. When we showed that during the downs the resource usage of our server was below 8% (charts provided by their own system), they told us that the problem was probably in our detection system, Monitis, advising us... to move to a dedicated server. On my side I have to say that I had become fixated on the idea that the problem was reaching a "timeout" on their side (that is, that requests would at some point be "dropped"), while then I understood that I was very wrong, because that "timeout" I saw came from reaching the tolerable response threshold in seconds, set in the monitis timeout. But it is also true, and it is my opinion, that a site that takes more than 10 seconds to respond should in any case set off an alarm bell, especially if your company mainly sells shared hosting… if the time taken does not coincide with excessive consumption, by that customer, of the server's resources. Because otherwise it means that I am forced to move to a dedicated server because another customer is consuming too many resources. It's a bit like having to pay a fine on the beach to you who don't smoke because in the place where you were sitting others left cigarette butts.
And I should say anyway that, if the problem had been that our site was actually using too many resources, I would have had no problem getting a dedicated server. But the problem here continued to be the difficulty in finding a certain cause, and I wanted to find it.
These that follow are the charts of resource usage provided by the Keliweb panel itself, about 20 minutes after a series of timeouts one after another detected by MONITIS:
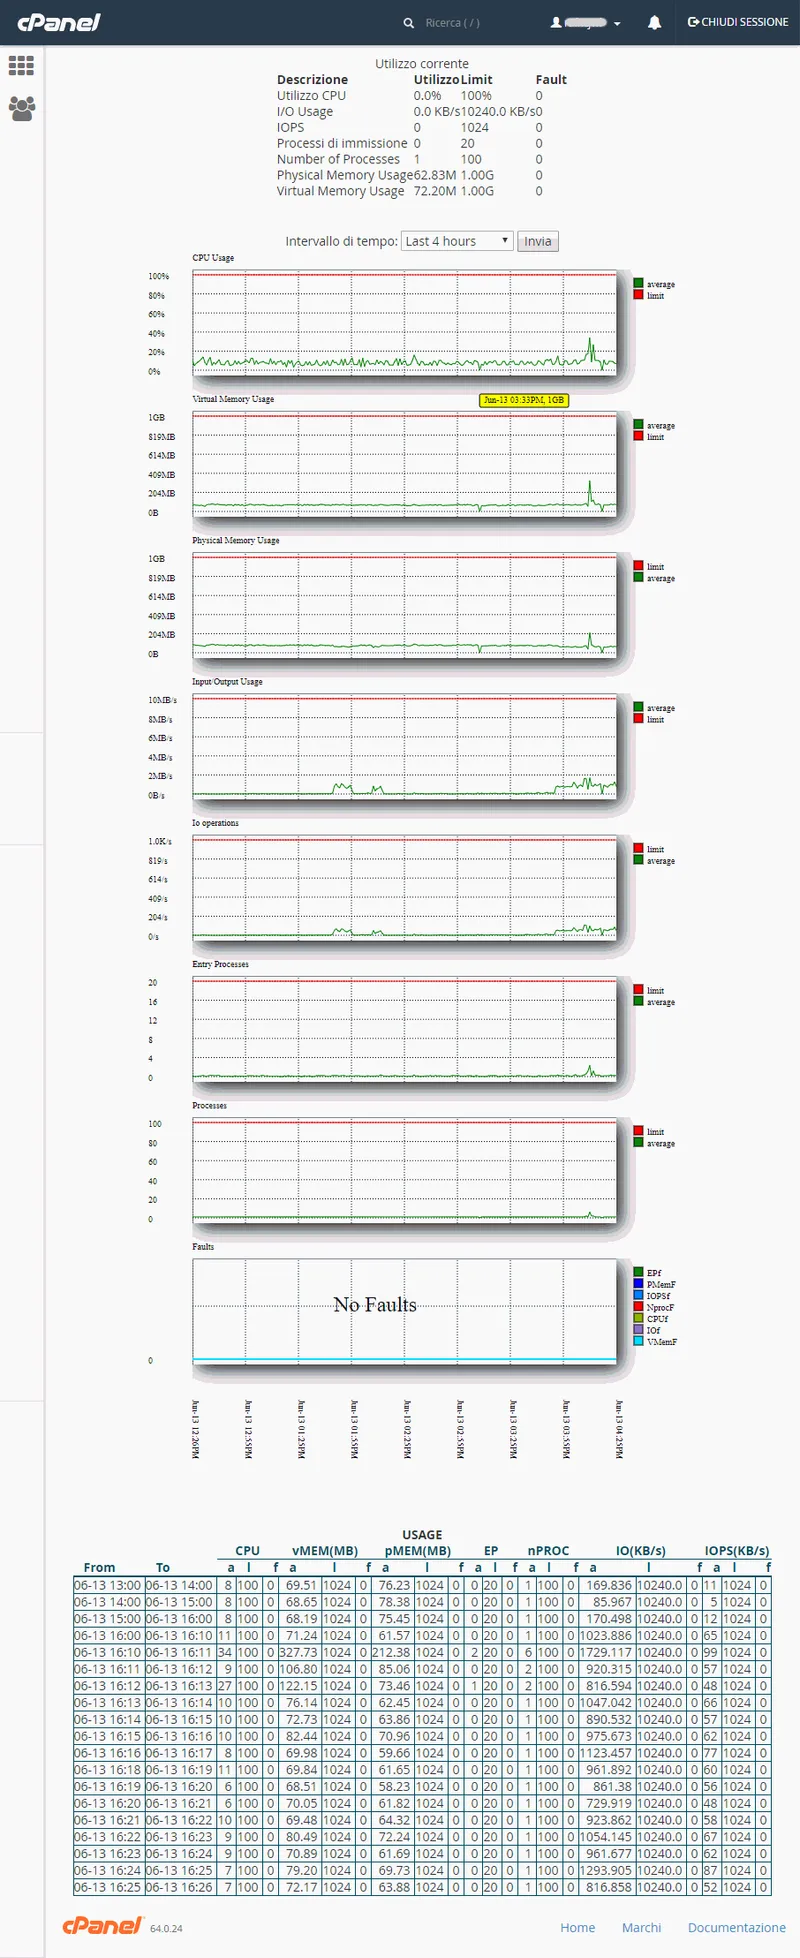
So, excluding routing problems and problems of excessive CPU usage (relating to our instance) (apart from that spike at 34% at 16:10), why did I keep getting such long and continuous loading problems ? Maybe the monitor does download the whole html page anyway, and maybe this page has a lot of content ? Or maybe it is a problem only of MONITIS and of all three webfarms at the same time (US-EAST, Italy and Spain) ? To remove any doubt I went to check with Google Chrome in debug mode to see the contents and, in detail, the download times directly from my PC (and further below also from those of friends). These are the results.
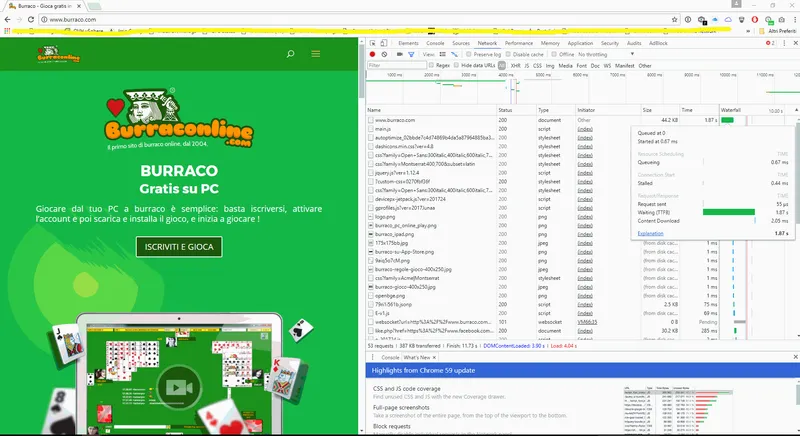
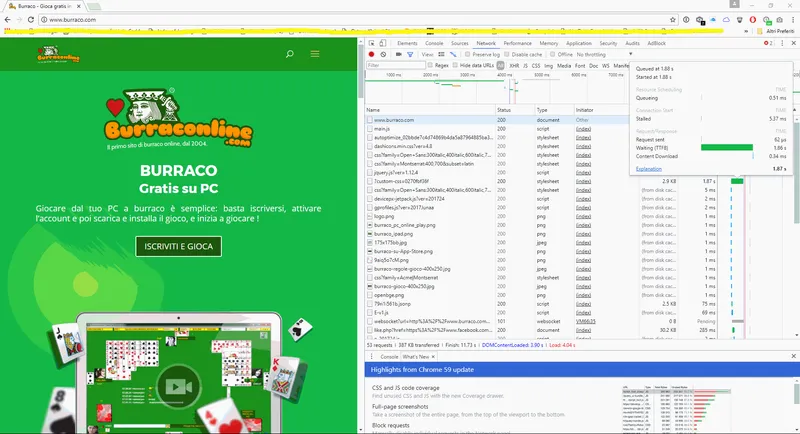
Note that to do this test I modified the hosts file of the machine to make it point directly to my dedicated IP at Keliweb, to avoid any redirects and/or problems linked to CloudFlare, and I pointed directly to http:// instead of https://. The "DOMContentLoad" gives me a full 3.90 seconds (I imagine that is 90 hundredths of 60 seconds, that is almost 4 seconds), which seems quite in line with the loading average detected by Monitis from Spain, from Italy and from US-EAST. But why does it take so long ? Considering that DOMContentLoad also includes the "conversion" phase of the text into the construction of the real DOM, meant as object model, it must be said that the CPU/performance of the PC also affects this process. But mine is a developer machine, 1 CPU with 8 Intel i7 cores and 32GB of RAM, on SSD disks, and above all very lightly loaded in terms of resources, so if I dare say that processing something like that might take 0.001 seconds (that is 1 millisecond), maybe I am even exaggerating (in pessimism).
So… let's go on … from a quick analysis (and here I did not go deeper, there would actually still be a lot of work to do, starting from here) I see that there is a fairly high TTFB, which is 1.87 seconds. It is basically the time the http server takes to provide the first byte of response. From the screenshot you can see that even for custom.css it took 1.86 seconds of TTFB. So it would seem to be a problem linked to server overload, which might not be able to satisfy requests in a shorter time because it is busy with other resources ? Finally it is the first sensible and verified answer that I start to accept…
Anyway, the "content download" has a more than acceptable value: 0.34 ms. So on one side the html page doesn't take up excessive space, and on the other side connectivity, understood as bandwidth speed/width, is confirmed to be fine. Everything would therefore seem to confirm the theory of a simple server overload/configuration problem, and maybe only of the one where I ended up.
One doubt still remains… could it be, besides a problem verified from three different Monitis locations, also a problem of mine with internet connectivity/download slowness ? Given that I have a 100Mbit fibre line, but I am in Malta, just in case I ran the same tests from the "home" PC of a friend who is in Rome and who uses Telecom Fibra as his internet connection… and the results are always the same, if not in some cases even worse:

From the screenshot above, taken at my friend's home in Rome, you can clearly see a TTFB of 3.43 seconds … and a DOMCONtentLoaded of 10.34 seconds… which confirms once again that the data from both MONITIS and my PC would seem to be all correct.
Ok, at this point I told myself… "maybe these are the normal data of all companies that do shared hosting"… just in case, let's check what happens on another WordPress site of mine hosted this time on GoDaddy:

The chart seems very, very linear… it doesn't have all those hysterics that KeliWeb has, and from Italy we even have 36ms as response times. The maximum spike was at 23:35 where a single request, from Italy, took 209 ms. A nice difference against the roughly 7 seconds of burraco.com that I have on Keliweb !! that is, about 97% less time. OK, but this is a different site, there will surely be other factors that could influence the result … so to do the final test … I took a hosting plan with SiteGround, I transferred all the WordPress files of burraco.com, I transferred the database, and I updated the DNS to point them to the new IP, without changing ANYTHING in the monitoring systems. Only the IP.
This is the result:

Response times went from peaks of 7,692 ms to 147 ms … in other words, I gained a speed of 52X …
And now let's see what happens to the HTTPS charts that go through CloudFlare…

It goes from 14,117 ms (that is 14 seconds) to 505 ms (that is half a second!)… in other words, I gained a speed 28X higher… at the very least.
However, we mustn't celebrate too soon ... it must be said that there could be a problem linked to DNS propagation times for the change of the host IP, and so monitis might be monitoring a site that only receives part of the requests (because the others would continue to arrive at the old server)... but it is also true that about a week before this whole analysis I had already lowered the TTLs of the individual DNS records to a few minutes (in anticipation...), but it is equally true that many providers don't care about the DNS RFCs (one among all, fastweb) and so I preferred to wait several more hours so that even the slowest DNS servers would update, and these are the results:
For HTTP requests, in practice I went from an average of 4,294 ms with peaks of around 6,000 / 7,000 ms (that is 7 seconds), to an average of 485 ms with much less recurring peaks of around 1,063 ms… let's say that the gain in terms of ratio is in any case about 10X, and in addition aesthetically I have a much more coherent, linear and less hysterical chart... a further sign that my performance was probably being impacted by some other customer.
Let's also take a look at the difference in HTTPS:

We went from an average of 4,480 ms, with peaks often around 15,000 ms (not counting that single spike over 20 seconds) to an average of 546ms with peaks of about 1 second. Here too the average gain is 10X but if we consider the frequency of spikes over 10 seconds, the gain in this case is about 20X…
After all these analyses and considerations, the key points I drew, based on the experience, were that:
1) Keliweb may turn out to be very slow when used as shared hosting, and when that happens it is not very interested in finding the causes of any slowdowns of a single website, always aiming to offer dedicated hosting as the solution. Which is not wrong from a commercial point of view, if the fault is actually of the customer who consumes too many resources, but it becomes a real injustice if the fault is... someone else's and I am forced to move to dedicated hosting for that reason ! Even if the support responds quickly, if your problem is performance, there are others to take into consideration like SiteGround (the main subject of this analysis) but also GoDaddy.
2) SiteGround and GoDaddy are both very valid alternatives, which in my tests did not have the problems that I did have at Keliweb.
I invite Keliweb, if interested, to contact me or to reply here if I have omitted some detail or have not considered something important (which can always happen)!
I thank everyone who had the patience to read the article up to here and… I await comments !
If you'd like to talk about it, write to me.
info@bitnrg.com
Comments
John
Superb material. Many thanks.
Michael
You actually stated that perfectly.